Build workflows on Apache Iceberg.
Work directly with Apache Iceberg tables.
Load files, join tables, and use snapshots to reproduce a result after the source data changes. Gnok streams query results as Apache Arrow.
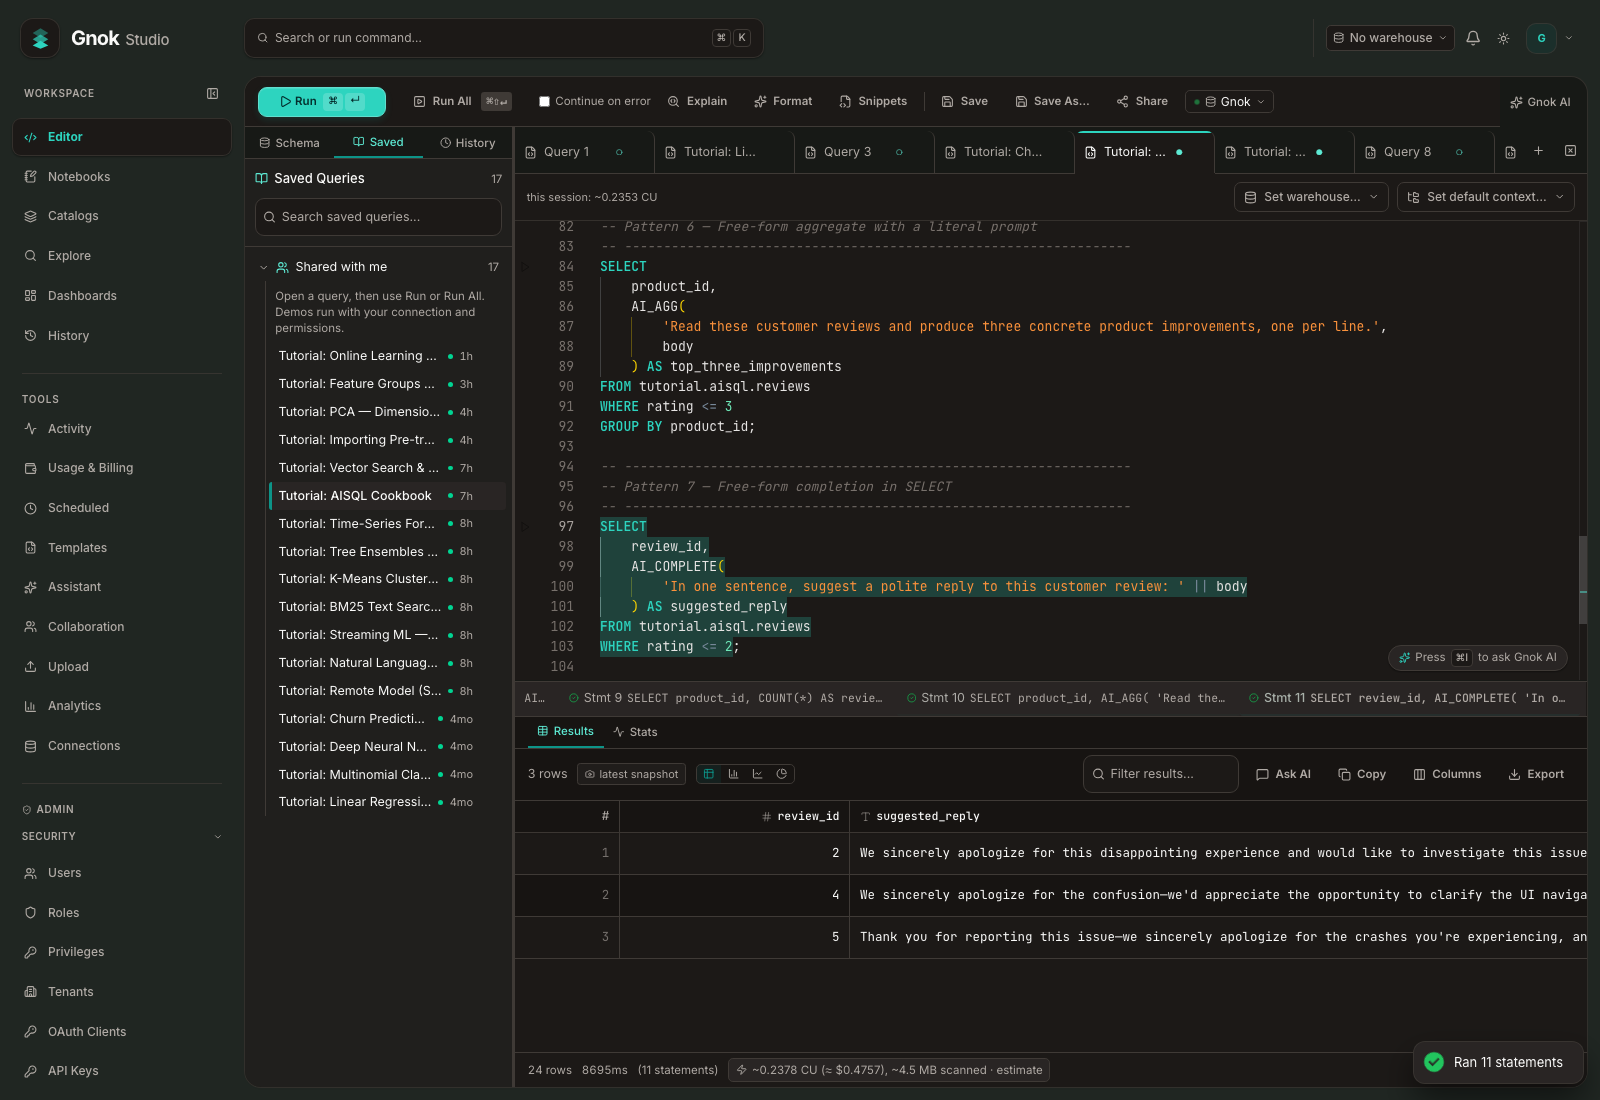
- Manage your tables
- Load files in the workspace or with COPY INTO, evolve table schemas, and query an earlier snapshot by ID or timestamp.
- Reuse business logic
- Group dependent writes in a transaction, run them in a stored procedure, or register a reusable WebAssembly function.
- Connect your tools
- Use the workspace editor or connect clients through Arrow Flight SQL, PostgreSQL wire, JDBC, or the Python SDK. Contact us to enable client access.
Turn raw tables into reusable datasets.
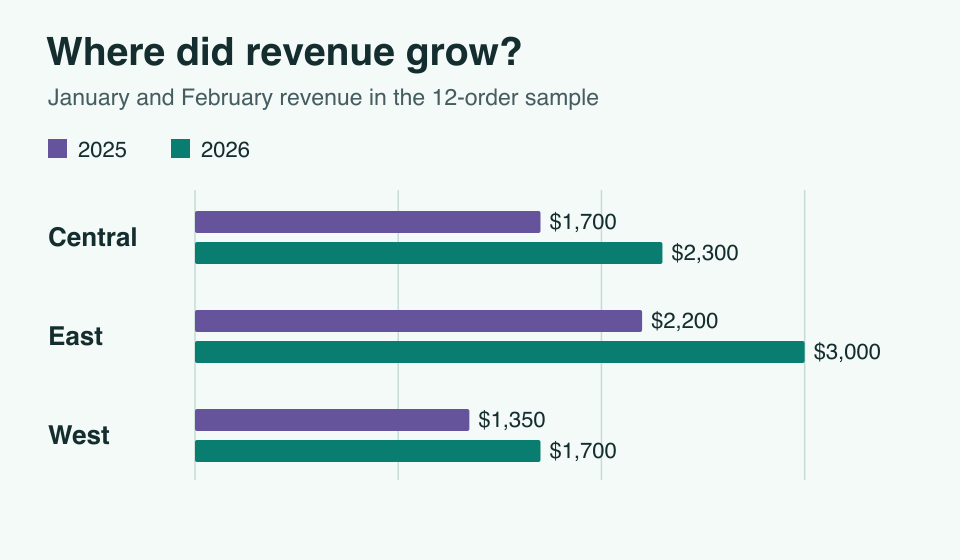
When Data Flows is enabled in your workspace, build transformations on a visual canvas. For a regional report, filter orders into two yearly branches, total each by region, and join the results.
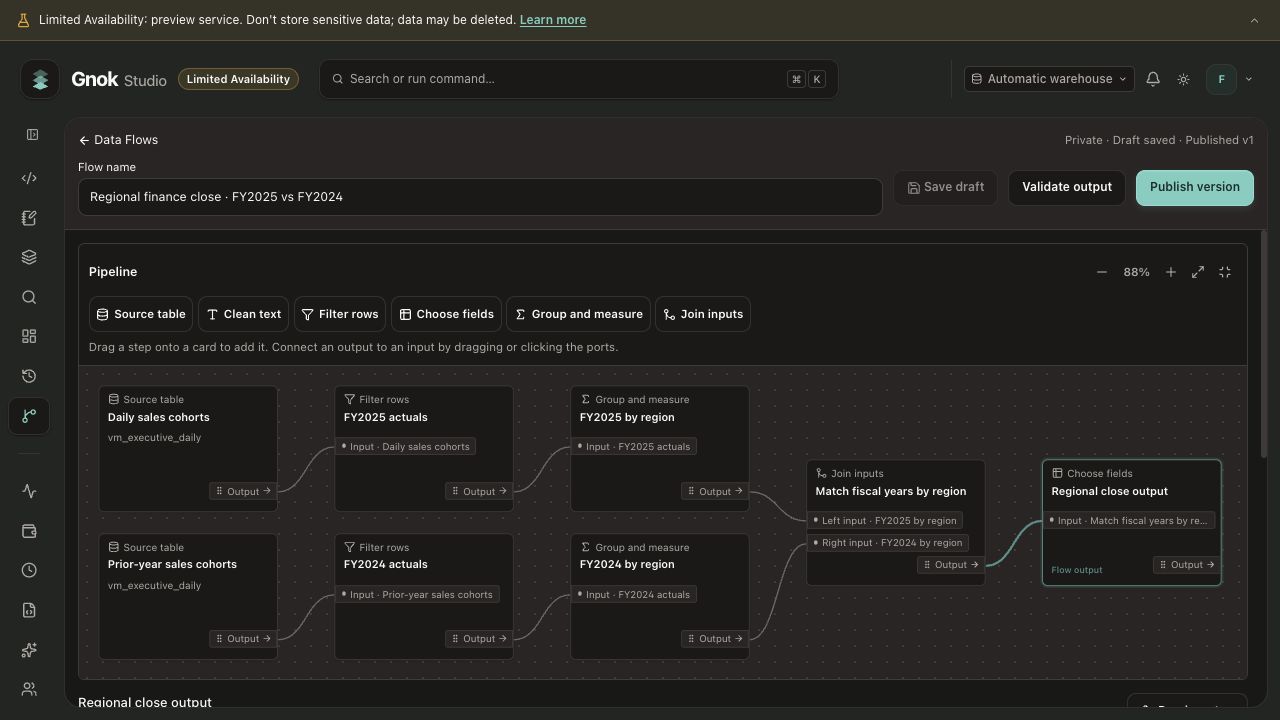
- Build and inspect each step
- Filter, reshape, aggregate, and join inputs. Preview rows and inspect unmatched keys before relying on the output.
- Validate before publishing
- Check required values, unique keys, or reconciled totals. Publish a version when the output meets those checks.
- Put the result to work
- Attach a published version to a dashboard as a live dataset, or write it to a destination table when enabled.
Train models and compare predictions.
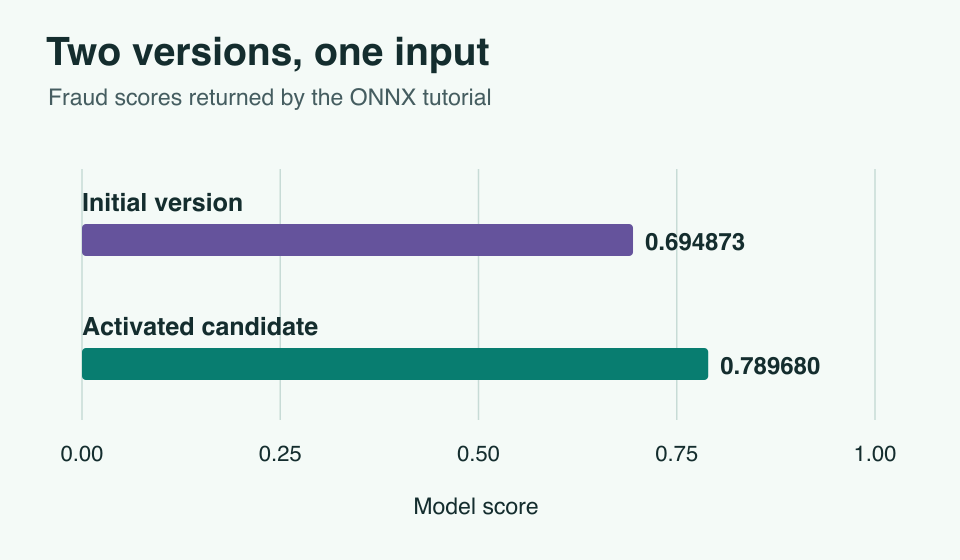
Train on the tables you already use. Score new rows and record the model version alongside each prediction.
- Train on your data
- Fit models for tasks such as churn classification, demand forecasting, and customer segmentation. Tune and evaluate supported models.
- Bring an existing model
- Import an ONNX model or register a model endpoint you already host.
- Check a candidate version
- Score the same inputs with the active and candidate versions before switching. Compare predictions with outcomes as they arrive.
- Keep models current
- Backfill feature groups and update supported models as new observations arrive with online learning.
Find answers in your own data.
Build a support search that finds the relevant refund policy and drafts an answer an agent can check against the source.
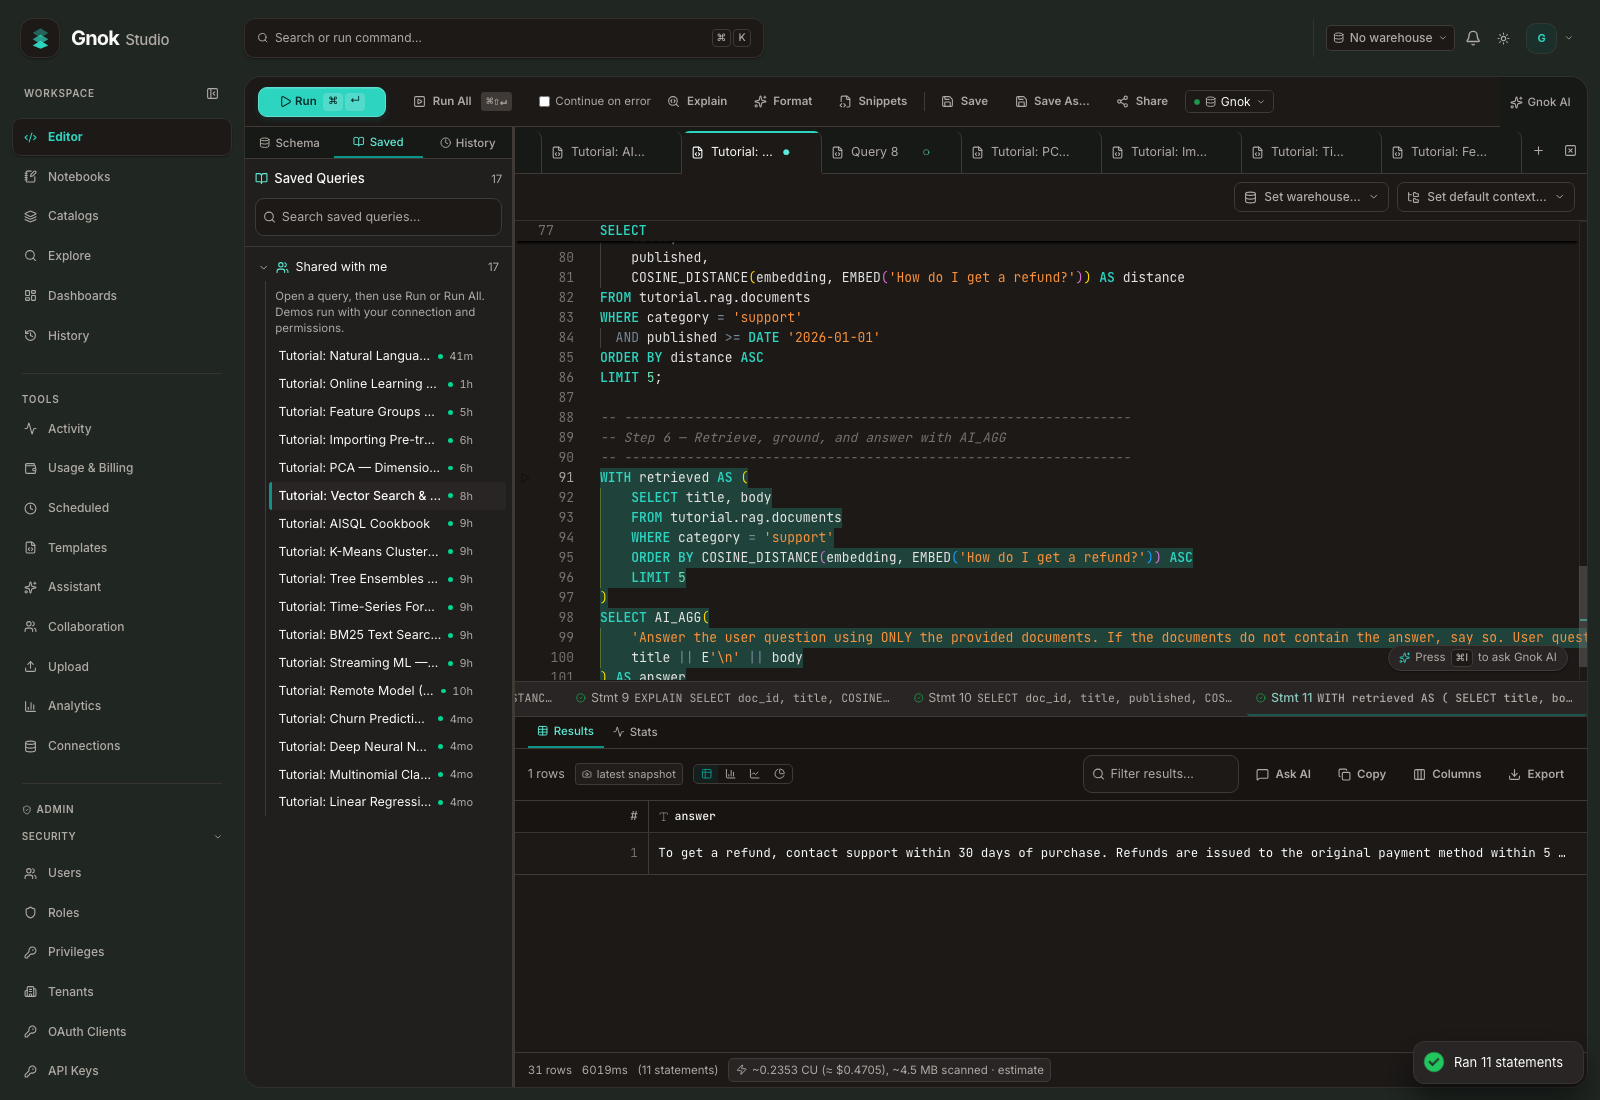
- Combine keyword and vector search
- Filter documents by category or date, then rank matches by words, meaning, or both.
- Work with text at scale
- Classify feedback, extract issues from reviews, summarize results, or draft a reply for each row.
- Ask questions in plain language
- Ask about a table, inspect the generated query, and ask a follow-up using the same session context.
- Set rules for model access
- Workspace administrators approve the provider, model, operations, and monthly token budget before language-model calls run.
Score new transactions as they arrive.
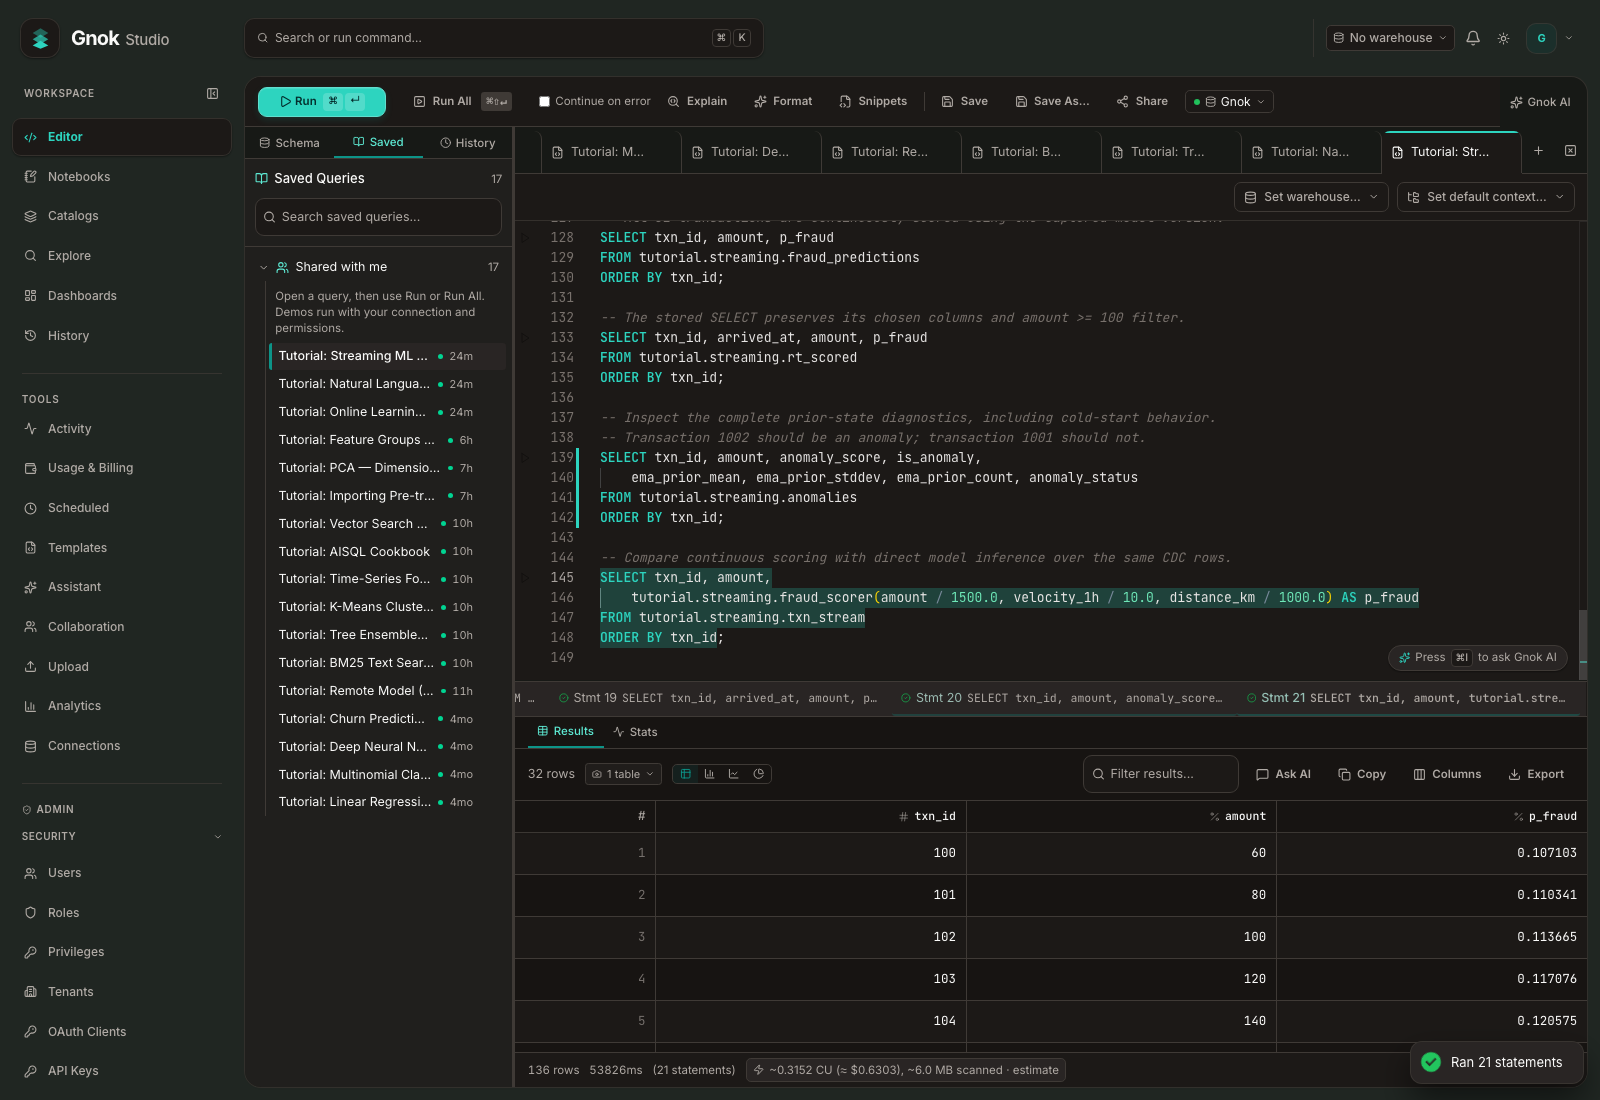
Keep new events in the same Iceberg tables you query. Use a stream to capture new rows for scoring or downstream processing.
- Ingest new events
- Write incoming records to Iceberg and query them alongside historical data.
- Compare different signals
- Apply a trained fraud model and flag amounts that depart from a recent moving average.
- Refresh downstream results
- Use scheduled tasks or dynamic tables to keep derived results current where enabled.
Explore results and share them with your team.
Follow a question from a worksheet or notebook to a published dashboard. Give readers filters they can use to answer follow-up questions.
- Explore in a worksheet or notebook
- Inspect query results, save an example for your team, or pass a result into Python to calculate growth.
- Publish a dashboard
- Use queries or a published flow as the source for charts and tables. Add a region selector so a reader can explore their results.
- Start from a working example
- Open shared tutorials in your workspace and follow the steps with sample data.
Publish one dashboard with the right view for each role.
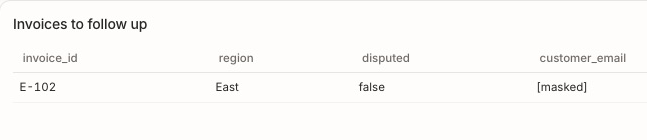
Apply workspace policies when someone opens shared results. On the invoice dashboard, an analyst can work across regions while the East manager sees only East invoices.
- Control which data each role can see
- Give roles access to tables, filter rows by policy, and mask sensitive columns such as customer emails.
- Manage workspace identities
- Use passkeys and MFA, connect an identity provider with OIDC or SAML, and provision members with SCIM.
- Review access changes
- Inspect grants and audit events when you need to trace who changed a policy or access rule.