From a notebook to a regional report
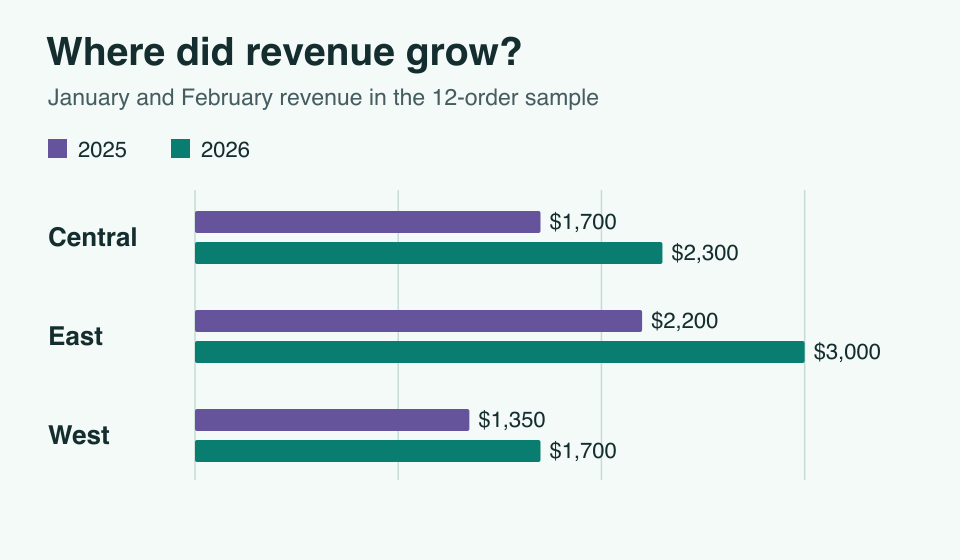
Finance wants to know which regions drove revenue growth. An analyst can explore the orders in a notebook, publish the comparison as a data flow, and give managers a dashboard they can filter themselves.
Explore the orders in a notebook
Load 12 sample orders and sum revenue by year in a SQL cell. The next Python cell receives that result as a data frame. It calculates a 33.3% increase, from $5,250 to $7,000, for the two-month period.
Save the notebook and run all its cells from a fresh kernel to reproduce the analysis. A parameter cell can hold a reporting period or region for a later run. Recreate the notebook
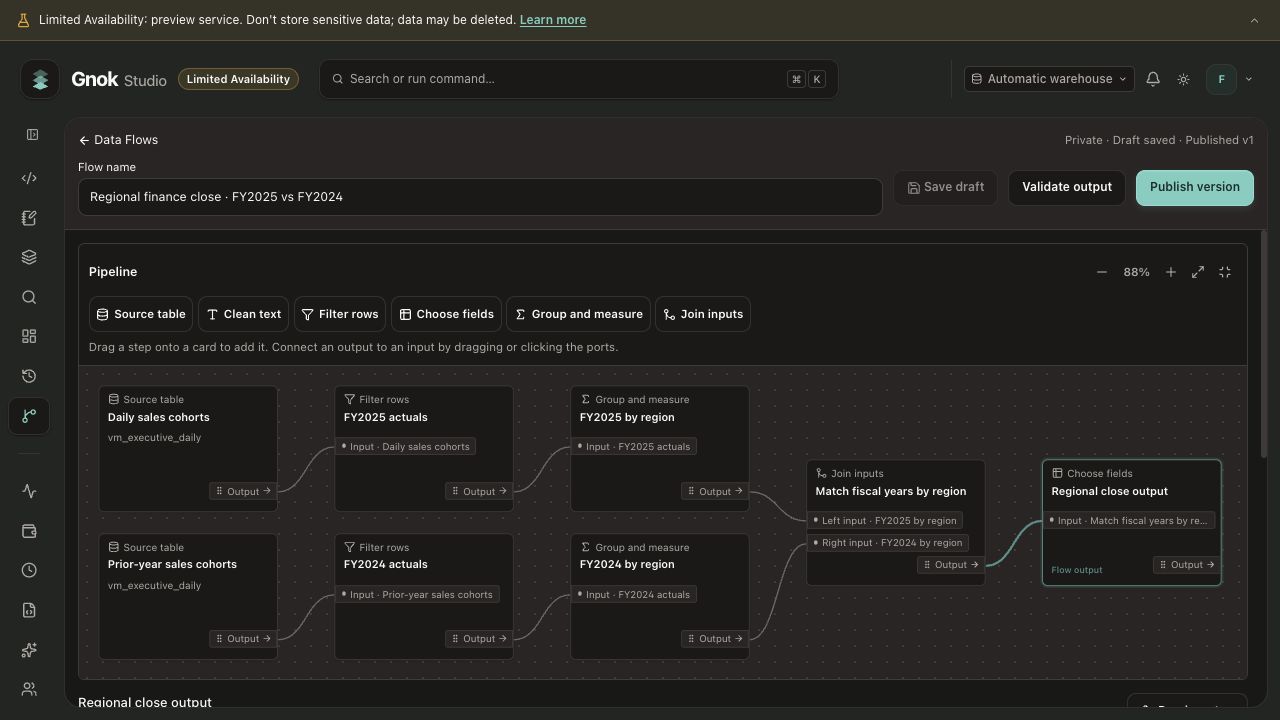
Publish the regional comparison
Branch the orders by year, sum revenue for each region, then join the two branches on region. Check for duplicate keys before you publish. The resulting dataset has one row per region and a measure for each year.
Let a reader explore the result
Attach a published flow version to a dashboard and bind its fields to a chart. In the tutorial, selecting East changes the revenue metric from $7,000 across all regions to $3,000 for East.
A region selector changes the question a reader is asking. Their data permissions determine which rows the query can return. When the business rule changes, attach the new flow version and republish the dashboard. Publish the revenue dashboard